Located At
Open Today Sales: 9 AM-7 PMOpen Today Service: 7:30 AM-6 PM


Long-Term Ownership Comparison
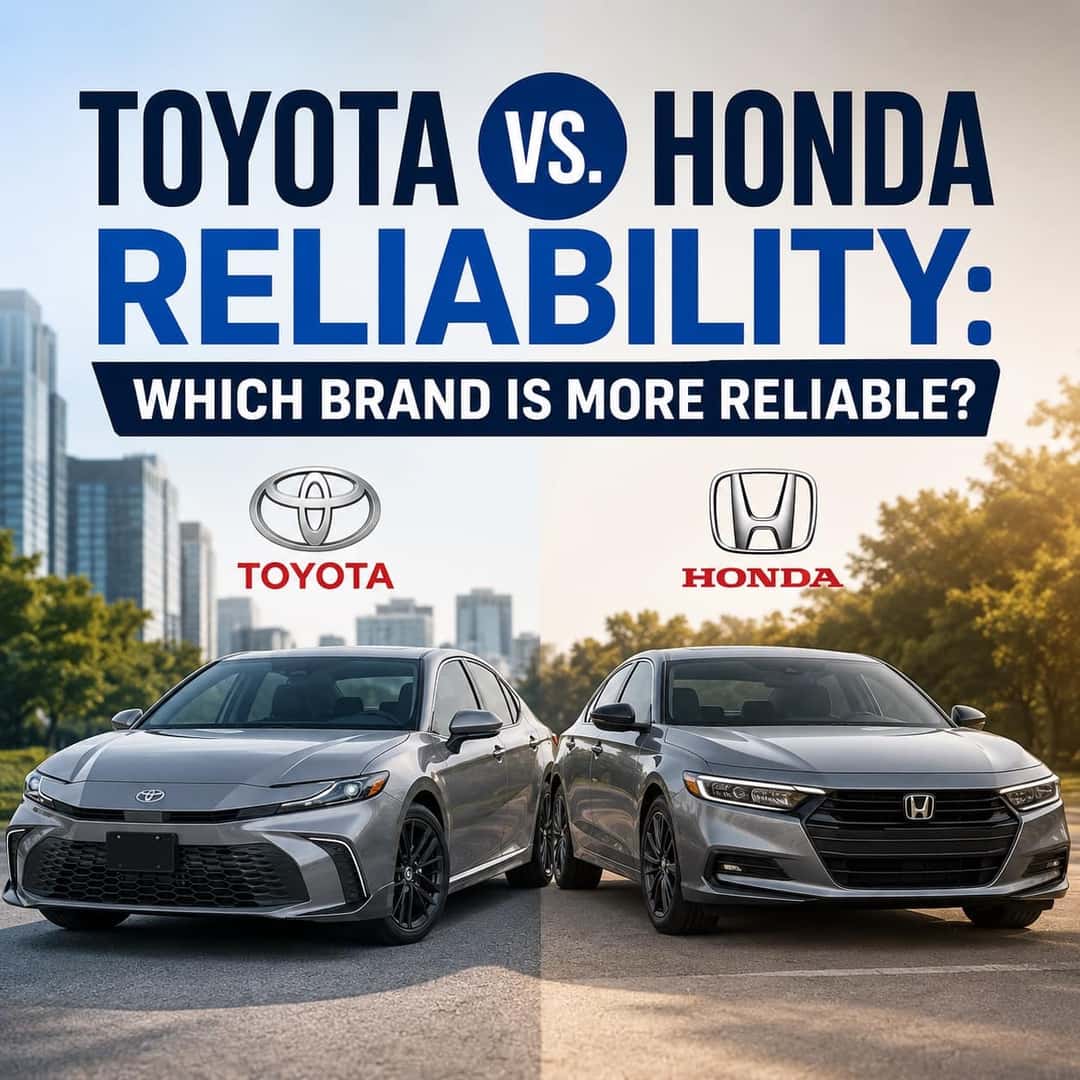
If reliability is one of your top priorities, Honda and Toyota are two of the strongest places to start. Both brands consistently perform well in reliability and longevity research, both have models with decades of owner history behind them, and neither should be dismissed simply because one study ranks the other higher.
So which would we choose? For most shoppers, we give Honda the edge. The reason is not that Toyota lacks an impressive reliability record. It clearly has one. Toyota currently leads several broad studies of predicted reliability, extreme-mileage longevity, and brand-wide resale value. Honda’s case becomes especially compelling when reliability is measured through the ownership experience itself: RepairPal ranks Honda first among 32 brands in its reliability data, with lower average annual repair and maintenance cost than Toyota, fewer unscheduled repair visits, and a lower probability of a severe repair.
Honda also remains firmly in the upper tier of extreme-mileage vehicles. In iSeeCars’ longevity study, Honda is one of only four brands above the overall industry average for the predicted likelihood of reaching 250,000 miles. In the non-luxury category, only Toyota and Honda finish above average. Honda therefore does not require shoppers to choose between everyday reliability and long-term durability.
That distinction matters for Boulder County and Front Range drivers who may accumulate substantial mileage through US 36 commuting, CO 119 travel, family schedules, airport trips, winter driving, and weekend travel. Most owners experience reliability through the years between the showroom and 100,000 or 150,000 miles—not solely through whether a vehicle eventually reaches a quarter-million miles.
There is no single universal reliability score. Different sources measure different parts of ownership, so the useful question is which evidence best matches how you expect to own the vehicle.
|
Toyota vs. Honda Reliability Scorecard
|
|||
|---|---|---|---|
| Measure | Honda | Toyota | Edge |
| RepairPal Brand Rank | 1st of 32 | 8th of 32 | Honda |
| Average Annual Repair & Maintenance Cost | $428 | $441 | Honda |
| Unscheduled Repair Visits | 0.31 / year | 0.34 / year | Honda |
| Severe Repair Probability | 10% | 12% | Honda |
| Consumer Reports 2026 New-Car Reliability | #4 | #1 | Toyota |
| Consumer Reports 2026 Used-Car Reliability | #4 | #2 | Toyota |
| Chance of Reaching 250,000+ Miles | 10.8% | 17.8% | Toyota |
| 2026 KBB Brand Resale Award | Civic, HR-V & CR-V win individual categories | Best Resale Value Brand | Toyota overall; Honda wins key model categories |
| Basic / Powertrain Warranty | 3 yr / 36,000 mi 5 yr / 60,000 mi |
3 yr / 36,000 mi 5 yr / 60,000 mi |
Comparable |
At first glance, this scorecard looks mixed—and that is exactly why a simple statement such as “Toyota ranks first, so Toyota is more reliable” is incomplete. Consumer Reports is especially useful for predicted new-car reliability. iSeeCars asks an extreme-longevity question. RepairPal asks what repair cost, frequency, and severity have looked like in a large historical population of vehicles already on the road.
For the ownership experience most drivers encounter, Honda’s RepairPal results deserve significant weight. Honda leads Toyota in all four of the RepairPal brand measures shown above. The differences are not dramatic enough to call Toyota unreliable; they are strong enough to show that choosing Honda does not mean accepting a reliability compromise.
RepairPal methodology note: its Reliability Rating uses historical repair information covering 2010–2019 model-year vehicles. These figures are useful evidence about established ownership patterns but should not be interpreted as a prediction for every current Honda or Toyota model.
Toyota’s strongest numbers deserve respect. Honda earns our recommendation because reliability is only useful when it translates into the way people actually own and use a vehicle.
Why it matters: Reliability is not only whether an engine can survive extreme mileage. It is also how often an owner faces an unexpected shop visit, how expensive repairs tend to be, and how often those repairs become serious.
Honda’s lower brand averages for annual repair and maintenance cost, unscheduled repair frequency, and severe-repair probability make a strong ownership argument. Toyota performs well too, but Honda leads each of those measures in the RepairPal dataset.
Why it matters: Toyota’s 250,000-mile result is better, but the Honda number needs context before being treated as a weakness.
iSeeCars estimates Honda’s chance of reaching 250,000 miles at 10.8%, more than twice the 4.8% overall industry average. Among mainstream brands, Toyota and Honda are the only two above the non-luxury average. Honda therefore remains an outlier for durability even in the study Toyota wins.
Why it matters: No one buys the statistical average of an entire automotive brand.
The CR-V is a useful example. RepairPal rates the Honda CR-V 4.5 out of 5.0 and second among 26 compact SUVs, compared with 4.0 out of 5.0 and third place for the Toyota RAV4. The CR-V also carries a lower historical average annual repair cost and slightly lower severe-repair probability in that dataset.
Why it matters: Strong resale can reduce the long-term cost of ownership even if you never plan to reach 200,000 miles.
Toyota earns KBB’s 2026 Best Resale Value Brand award, but Honda wins three important individual categories: Civic for compact cars, HR-V for subcompact SUVs, and CR-V for compact SUVs. Shoppers therefore need the model-level resale picture, not only the brand trophy.
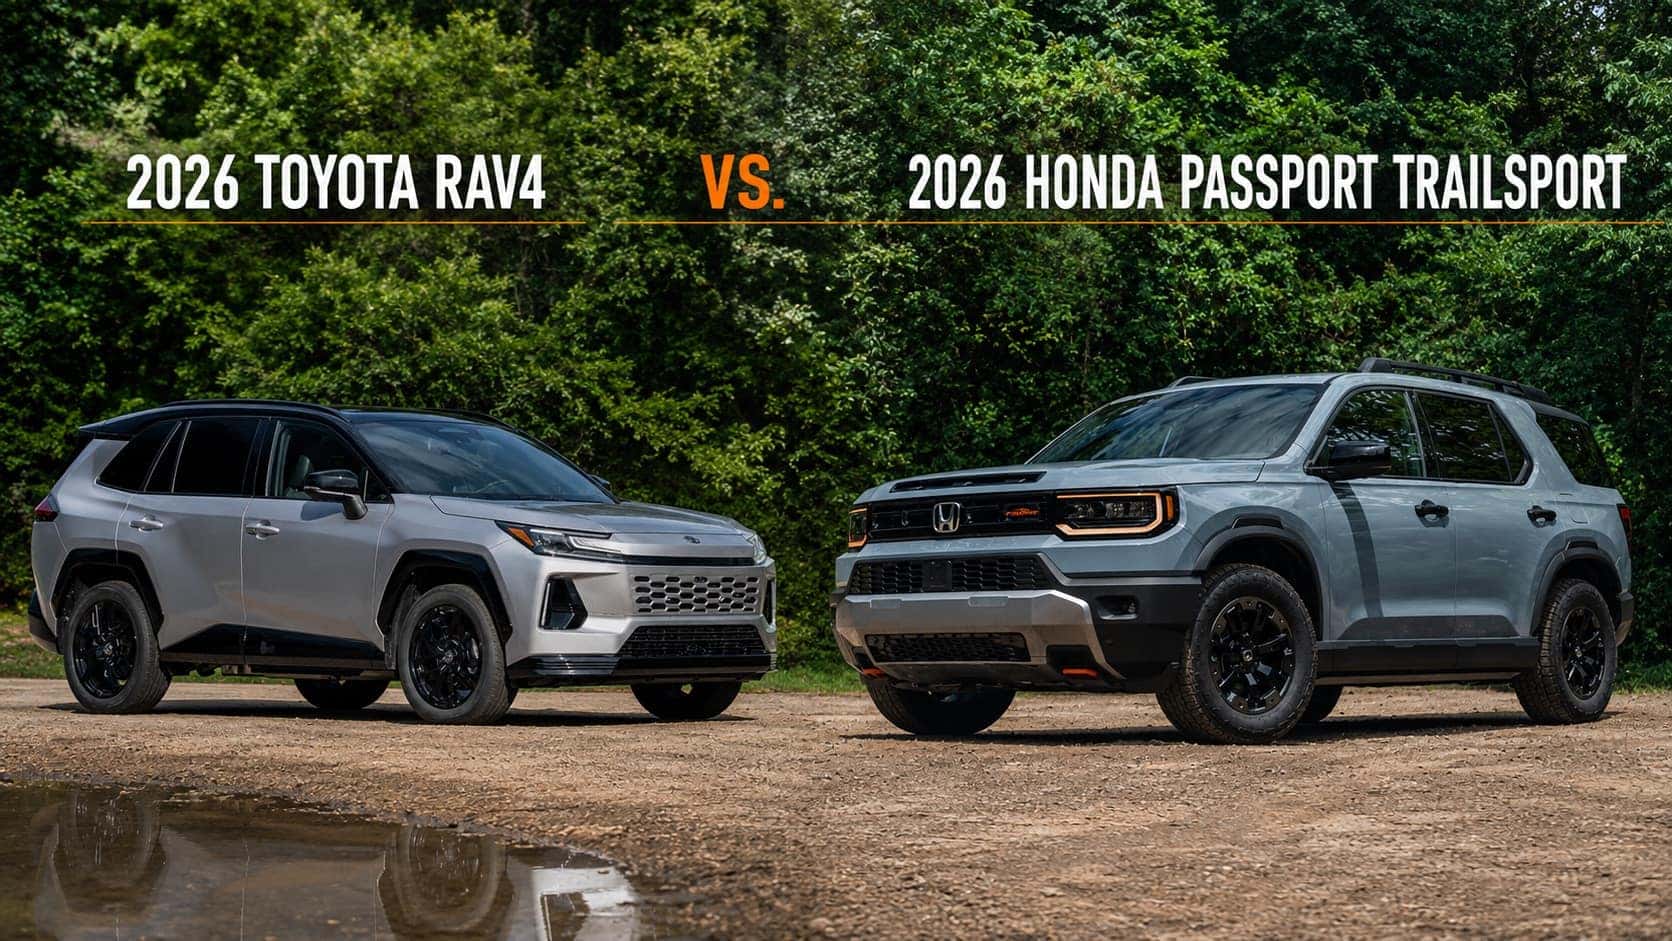
Once Honda and Toyota both clear the threshold of being highly reliable brands, the exact vehicle becomes more important.
Toyota’s reliability reputation is well supported by current data. Consumer Reports currently ranks Toyota first for new-car reliability and second for used-car reliability. iSeeCars gives Toyota the highest brand-wide probability of reaching 250,000 miles, and Kelley Blue Book names Toyota its 2026 Best Resale Value Brand.
Included maintenance is another point to compare carefully by model year. ToyotaCare covers normal factory-scheduled maintenance for 2 years or 25,000 miles on Toyota vehicles from model year 2026 and earlier. For most model-year 2027 Toyota vehicles, current ToyotaCare coverage is 1 year or 10,000 miles. Honda Service Pass on eligible 2026 Hondas covers the first factory-scheduled maintenance for 1 year or 12,000 miles. Toyota’s hybrid-battery warranty is another strength for shoppers specifically focused on very long hybrid ownership.
Those are legitimate Toyota advantages. They matter most to shoppers who place extreme mileage, resale value, included maintenance, or long-horizon hybrid ownership near the top of the decision. The broader question is whether those advantages outweigh Honda’s repair-history results, model-level strengths, vehicle fit, driving experience, packaging, and ownership priorities for you.
Instead of asking which badge wins every category, match the reliability evidence to your actual ownership plan.
Our Pick for Most Shoppers
Best Fit: You want top-tier dependability without making an extreme-mileage brand statistic the only factor in the purchase.
Honda combines RepairPal’s top brand ranking, low historical repair costs, low repair severity, well-above-average longevity, strong resale performers, and model choices that can outperform Toyota rivals individually. That is why Honda is our default recommendation for the broader group of buyers.
Best Fit: Your top priority is maximizing brand-level evidence for reaching extremely high mileage, resale value, or longer included maintenance on an applicable model year.
Toyota’s case is strongest here. Its Consumer Reports, iSeeCars, KBB, applicable ToyotaCare, and hybrid-battery advantages are meaningful for buyers who place those measures above the other differences between individual Honda and Toyota models.
Best Fit: You are comparing two actual pre-owned vehicles rather than abstract brand averages.
At this stage, maintenance records, accident history, model year, mileage, recall completion, inspection results, tires, brakes, fluids, and prior care can matter more than the difference between Honda and Toyota’s brand averages.
Not by themselves. A recall addresses a safety defect or regulatory issue, and one campaign can affect a very large number of vehicles. Comparing raw Honda and Toyota recall totals can therefore create more confusion than useful reliability insight.
For a used vehicle, the better question is whether that specific VIN has an unrepaired safety recall. NHTSA’s recall lookup allows shoppers to search an individual VIN or license plate for open recall information.
That is another reason we would rather evaluate the actual Honda you are considering than make a purchase decision from a brand-wide recall count.
Rather than use a single ranking, this guide separates predicted reliability, historical repair experience, extreme-mileage longevity, resale value, warranty coverage, and model-level results. That prevents one measurement from being presented as though it answers every reliability question.
If we had to recommend one brand for the broader group of shoppers asking this question, we would choose Honda. Toyota has the stronger result in several important brand-wide studies, especially predicted new-car reliability, extreme-mileage longevity, and overall resale value. Those strengths are real and deserve to be part of the decision.
Honda’s advantage is the completeness of its ownership case. RepairPal places Honda first among 32 brands and shows lower historical average repair costs, fewer unscheduled visits, and a lower severe-repair probability than Toyota. Honda also remains one of the industry’s strongest brands for 250,000-mile longevity, and important individual models such as the CR-V can outperform their Toyota counterparts in model-level reliability data.
That makes Honda especially compelling for shoppers who want reliability without reducing the decision to one statistic. You still get a brand with an exceptional long-term record while choosing the vehicle around the space, efficiency, hybrid system, driving experience, features, capability, and everyday usability you actually need.
For a new vehicle, compare equivalent Honda and Toyota models rather than brand reputations alone. For a used vehicle, go one step further and compare the exact model year, maintenance history, condition, and recall status. The Honda badge gives you an excellent reliability foundation; the right Honda and proper maintenance turn that foundation into long-term ownership confidence.
At Fisher Honda, we think reliability research should end with a vehicle rather than a brand ranking. Once Honda and Toyota both clear the threshold of being genuinely dependable brands, the more useful comparison is whether the exact Honda gives you the space, efficiency, driving experience, winter usability, technology, capability, and ownership costs that fit your routine.
That approach fits how we have served Boulder-area drivers as a family-owned dealership with roots dating to 1968: explain the options clearly, keep the process straightforward, and help you make a decision that still makes sense after the purchase.
Our Honda research hub can help you compare current CR-V, CR-V Hybrid, HR-V, Pilot, Ridgeline, Civic, Accord, Prologue, Passport, and Odyssey options before moving to a specific vehicle. If long-term ownership is part of the plan, our service team can also help you understand Honda Maintenance Minder recommendations and the maintenance schedule for the Honda you select.
Move from brand-level reliability research to the Honda model, ownership information, and comparison that fit the way you plan to drive.
Keep Researching
Start Shopping
DISCLAIMERS:
*Reliability rankings, repair-cost averages, longevity projections, resale-value estimates, and other third-party research use different methodologies, vehicle populations, and model years. Brand-level results do not guarantee the reliability, repair cost, resale value, or service life of an individual vehicle.
*RepairPal’s Reliability Rating uses historical repair information covering 2010–2019 model-year vehicles. RepairPal figures should be interpreted as historical ownership evidence rather than predictions for a specific current model-year vehicle.
*Repair and maintenance costs vary by model, model year, mileage, location, labor rates, maintenance history, driving conditions, vehicle condition, and other factors.
*Longevity percentages are statistical projections and do not guarantee that any individual vehicle will reach a specified mileage.
*Warranty, complimentary maintenance, hybrid-system coverage, eligibility, terms, and exclusions vary by model, model year, original in-service date, location, and manufacturer requirements. Verify current coverage before purchase.
*Resale values are projections and may vary based on mileage, condition, market demand, vehicle history, configuration, location, and other factors.
*Recall information should be checked for the specific vehicle. Visit NHTSA.gov/Recalls or the applicable manufacturer recall resource for current information.
*Third-party ratings, rankings, manufacturer programs, warranty terms, and complimentary maintenance programs may change as methodologies, model years, and program terms are updated.
